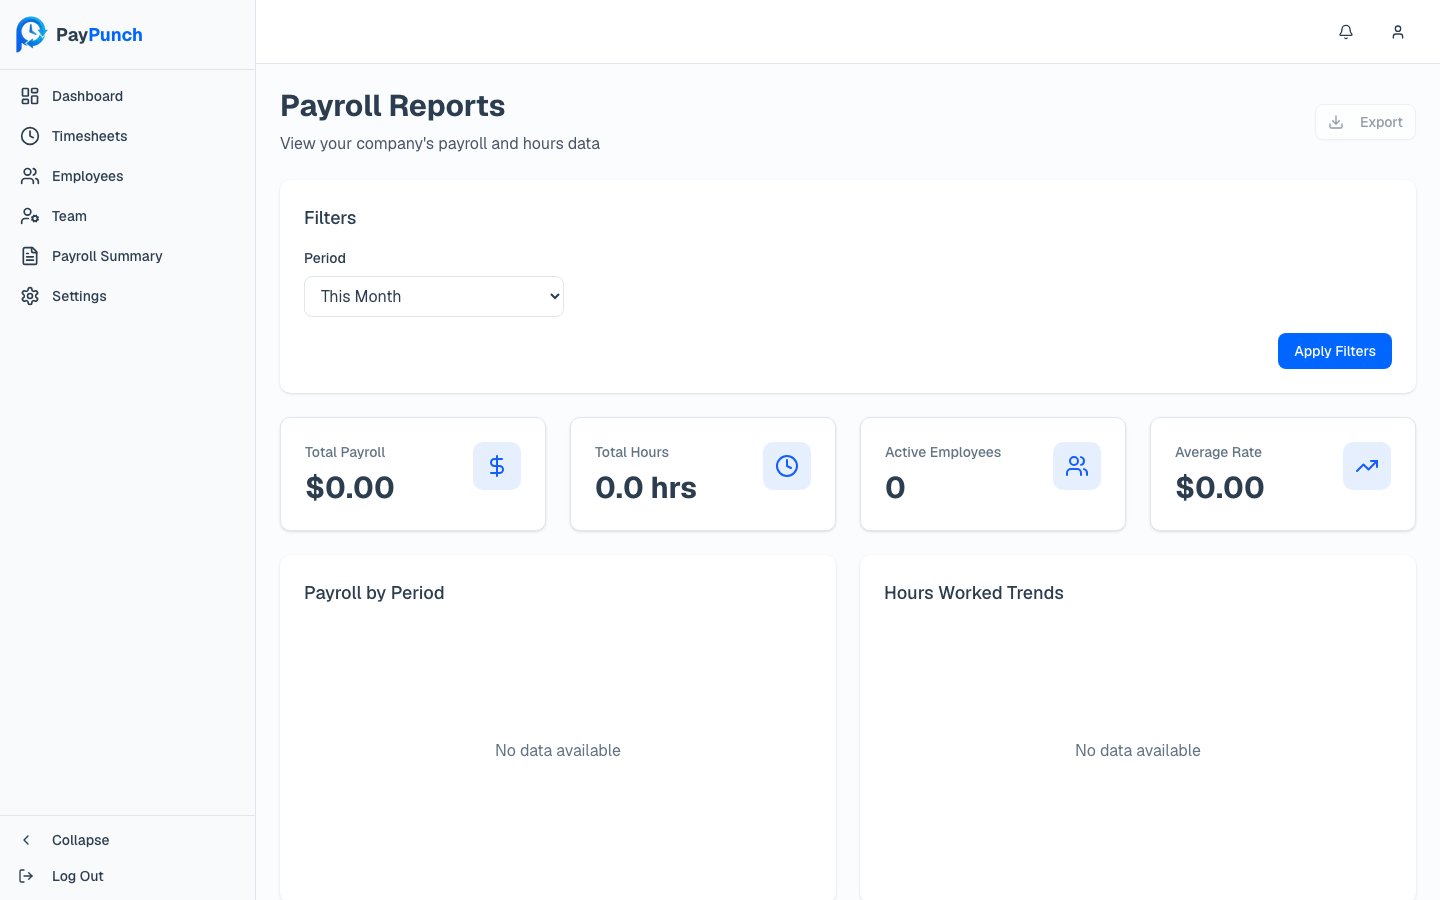
Choosing what you see
- Period dropdown — defaults to This Month.
- Date range — optionally override the period with a custom start and end date.
Metrics at a glance
Metric cards summarize the selected period:Total Payroll
Total labor cost for the period.
Total Hours
All hours worked in the period.
Active Employees
Employees with time in the period.
Average Rate
Average hourly rate across the period.
Overtime Payroll
Cost attributable to overtime.
Overtime Percentage
Overtime as a share of total hours.
Detailed reports and exports
Below the charts, two detail reports let you drill in and export:- Payroll by Employee — each employee’s hours (regular and overtime), pay rate, and total payroll.
- Hours by Employee — each employee’s regular, overtime, and total hours.
CSV
A plain comma-separated file for spreadsheets and imports.
Excel
A native
.xlsx workbook.A formatted document with your company branding, page numbers, and a timestamp.
payroll-by-employee-2026-06-17.csv).
Reports are read-only and available to any signed-in user, including Viewers.