> ## Documentation Index
> Fetch the complete documentation index at: https://docs.paypunch.io/llms.txt
> Use this file to discover all available pages before exploring further.
# Reports
> View your company's hours and payroll data and export it to CSV, Excel, or PDF.
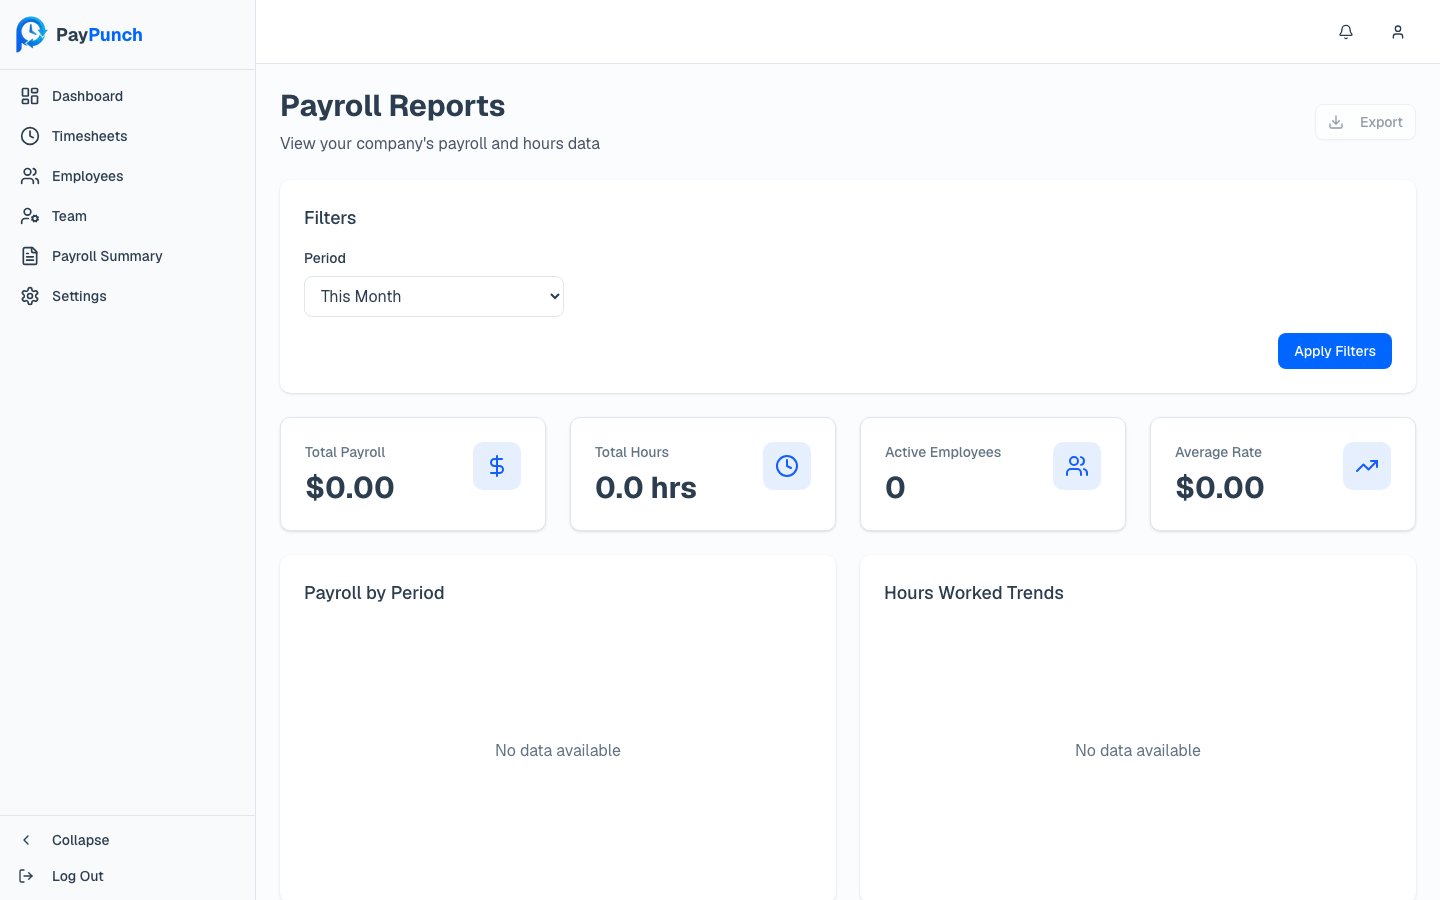
The **Reports** screen turns your time data into the numbers you need — total payroll,
hours, overtime, and per-employee breakdowns — and lets you export them. The header reads
**Payroll Reports** — *"View your company's payroll and hours data."*
 ## Choosing what you see
* **Period** dropdown — defaults to **This Month**.
* **Date range** — optionally override the period with a custom start and end date.
## Metrics at a glance
Metric cards summarize the selected period:
Total labor cost for the period.
All hours worked in the period.
Employees with time in the period.
Average hourly rate across the period.
Cost attributable to overtime.
Overtime as a share of total hours.
Two charts visualize trends: **Payroll by Period** and **Hours Worked Trends**.
## Detailed reports and exports
Below the charts, two detail reports let you drill in and export:
* **Payroll by Employee** — each employee's hours (regular and overtime), pay rate, and
total payroll.
* **Hours by Employee** — each employee's regular, overtime, and total hours.
Each report has an **Export** option offering three formats:
A plain comma-separated file for spreadsheets and imports.
A native `.xlsx` workbook.
A formatted document with your company branding, page numbers, and a timestamp.
Exported files are named by report type and date (for example, `payroll-by-employee-2026-06-17.csv`).
Reports are scoped to your own company automatically — there's no company picker in the
client portal, so everything you see and export is just your business's data.
Reports are read-only and available to any signed-in user, including **Viewers**.
## Choosing what you see
* **Period** dropdown — defaults to **This Month**.
* **Date range** — optionally override the period with a custom start and end date.
## Metrics at a glance
Metric cards summarize the selected period:
Total labor cost for the period.
All hours worked in the period.
Employees with time in the period.
Average hourly rate across the period.
Cost attributable to overtime.
Overtime as a share of total hours.
Two charts visualize trends: **Payroll by Period** and **Hours Worked Trends**.
## Detailed reports and exports
Below the charts, two detail reports let you drill in and export:
* **Payroll by Employee** — each employee's hours (regular and overtime), pay rate, and
total payroll.
* **Hours by Employee** — each employee's regular, overtime, and total hours.
Each report has an **Export** option offering three formats:
A plain comma-separated file for spreadsheets and imports.
A native `.xlsx` workbook.
A formatted document with your company branding, page numbers, and a timestamp.
Exported files are named by report type and date (for example, `payroll-by-employee-2026-06-17.csv`).
Reports are scoped to your own company automatically — there's no company picker in the
client portal, so everything you see and export is just your business's data.
Reports are read-only and available to any signed-in user, including **Viewers**.